 Blog
Blog
Adjusting sights with numbers
You adjust a sight after a series only if the point of impact sat in the same place in the series before it. The “MPI Deviation” view in Analytics shows exactly that, as dots on a target and as lines over time. From the offset in millimeters and the click value of your sight follows the correction. You record the clicks in the weapon profile. This creates a new profile version, and in the weeks after, the same view shows whether the point has moved to the center.
Anyone who readjusts the sight after every series mostly clicks after the last coincidence, and Analytics shows it: the point of impact jumps afterwards just as before, only in other directions.
Step 1: Is the offset stable?
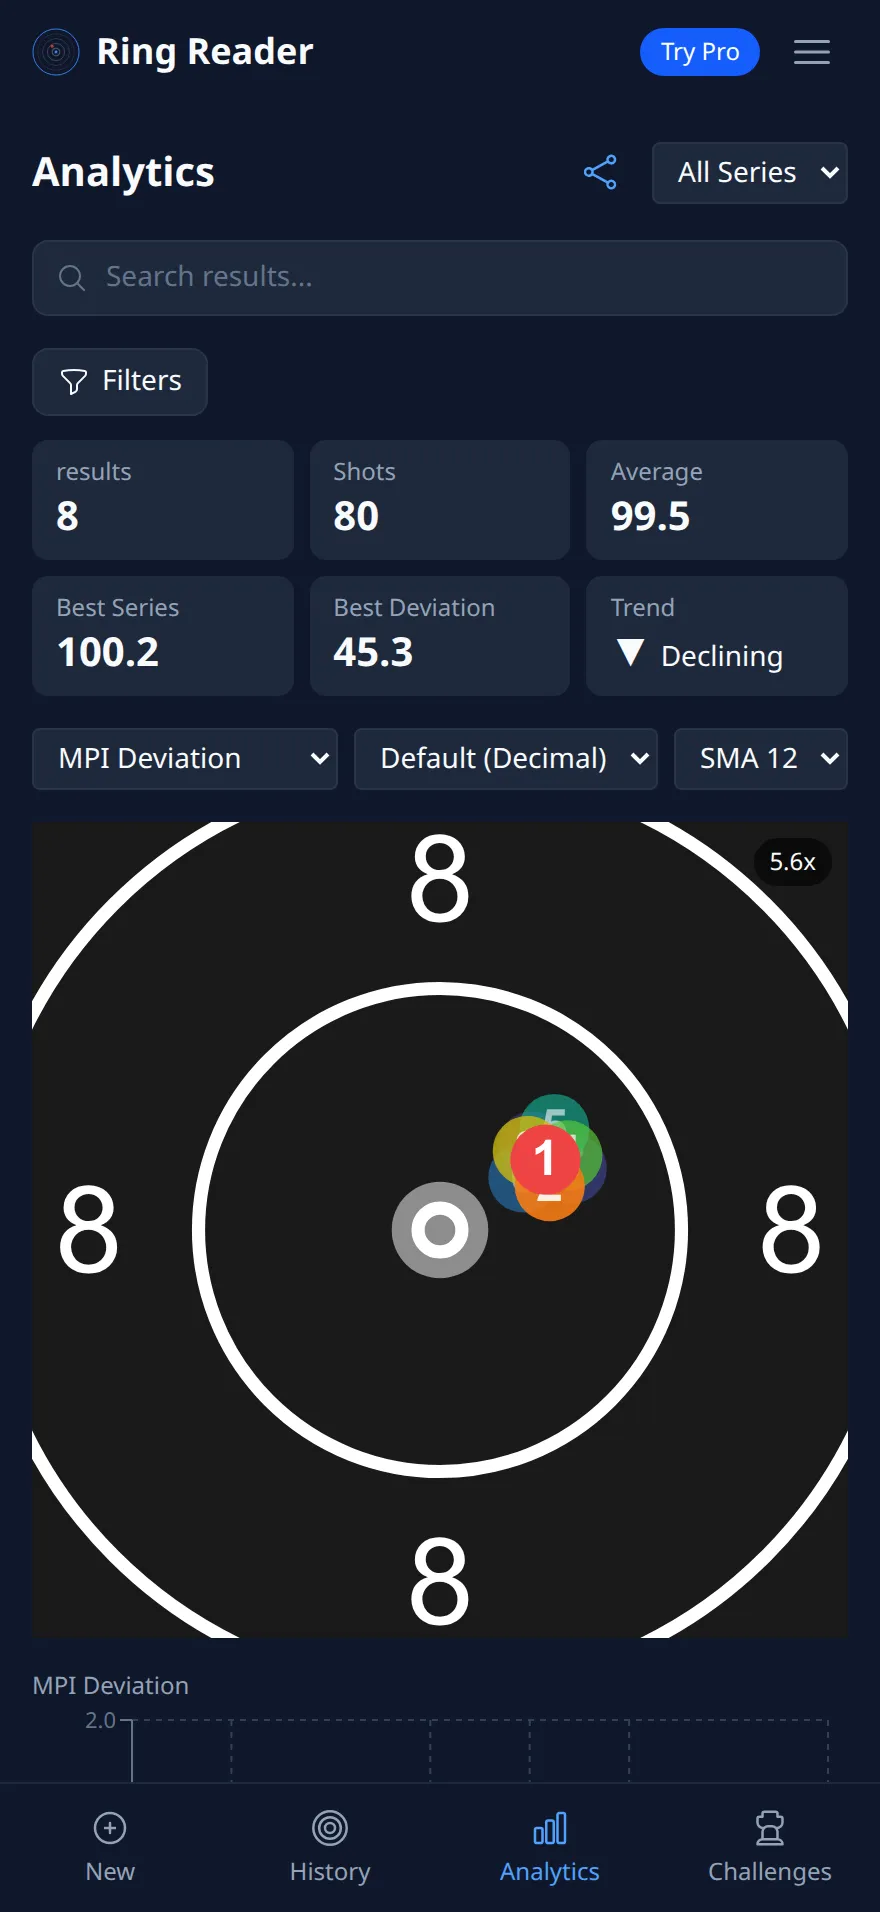
Open Analytics, pick “MPI Deviation” under “Chart type” and set the filter to the weapon in question. The polar chart shows every series as a dot at the spot of its mean point of impact, the newest in red, the last eight connected. If the cloud as a whole sits off center, with the dots close together, the offset is stable. If the dots are scattered on all sides of the center, there is nothing to correct on the sights, and every change makes it worse.
The lines below show the same over time: an X or Y line that has sat above zero for weeks is the offset. How I tell sights and technique apart from that is in What the mean point of impact says about your technique.
Step 2: How much and which way
The “MPI Offset” card on every result page gives the offset in millimeters, sideways and in height, and the moving average in the “MPI Deviation” view gives it averaged over many series. Take the averaged value. If the point of impact sits on average 1.2 mm right and 0.8 mm high, the sight has to bring the group 1.2 mm left and 0.8 mm down.
How many clicks that is depends on the click value of your sight: how far one click moves the group at the distance of the target. The sight click calculator has the values of common diopters from Anschütz to Walther and converts the offset into clicks for each of them, from millimeters or from a ring value and direction. The makers state their values for a long sight radius; when in doubt, the exact number is in the manual of your diopter. At 0.2 mm per click, 1.2 mm and 0.8 mm are six clicks left and four down.
The “Corrected” line on the same card says what the correction would bring, in rings for the series. If it shows a plus of half a ring or more, reaching for the sight is worth it, and at one or two tenths not quite yet. The line is explained in What would the series have scored without the sight error? Across your whole archive, the “Rings left on the table” card does the same math, described in Insights: six cards.
Step 3: Recording the clicks
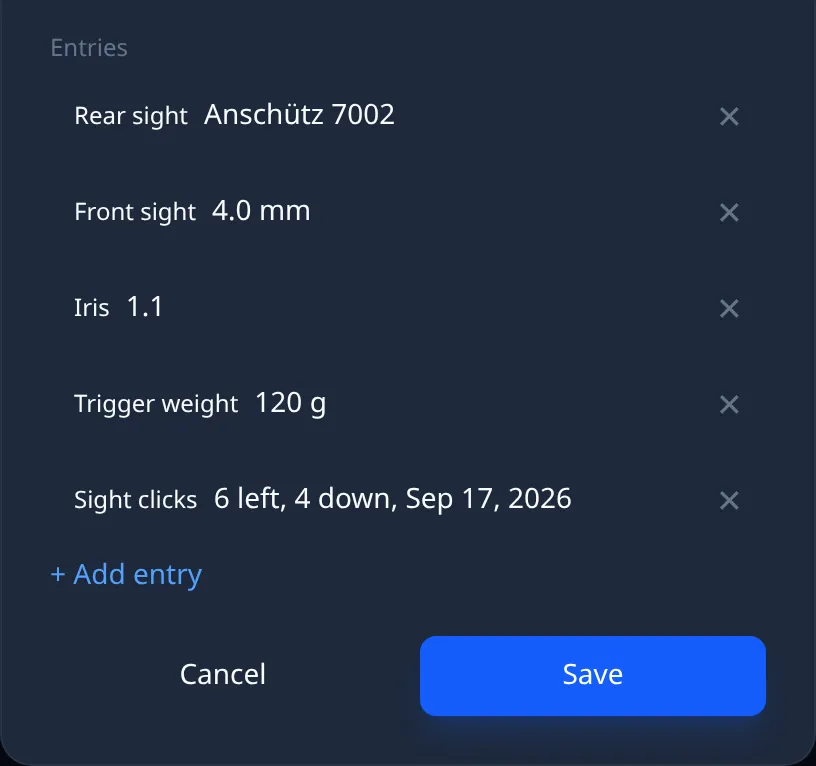
Before you turn, write down the setting. The weapon profile has the “Sight clicks” entry under “Suggestions”, and there you enter as the value what you set, “6 left, 4 down” for instance, with the date. Because the profile is already attached to series, Ring Reader creates a new version when saving, and the series before the correction keep the old setting. The training details of every series also have the “Clicks H” and “Clicks V” fields under “Gear & Setup” for deviations on a single day, say at an unfamiliar range.
Turn in one step and in both directions at once, and then leave it for three to five series. Anyone who readjusts after every series never sees in Analytics whether the first correction fit.
Step 4: Before and after
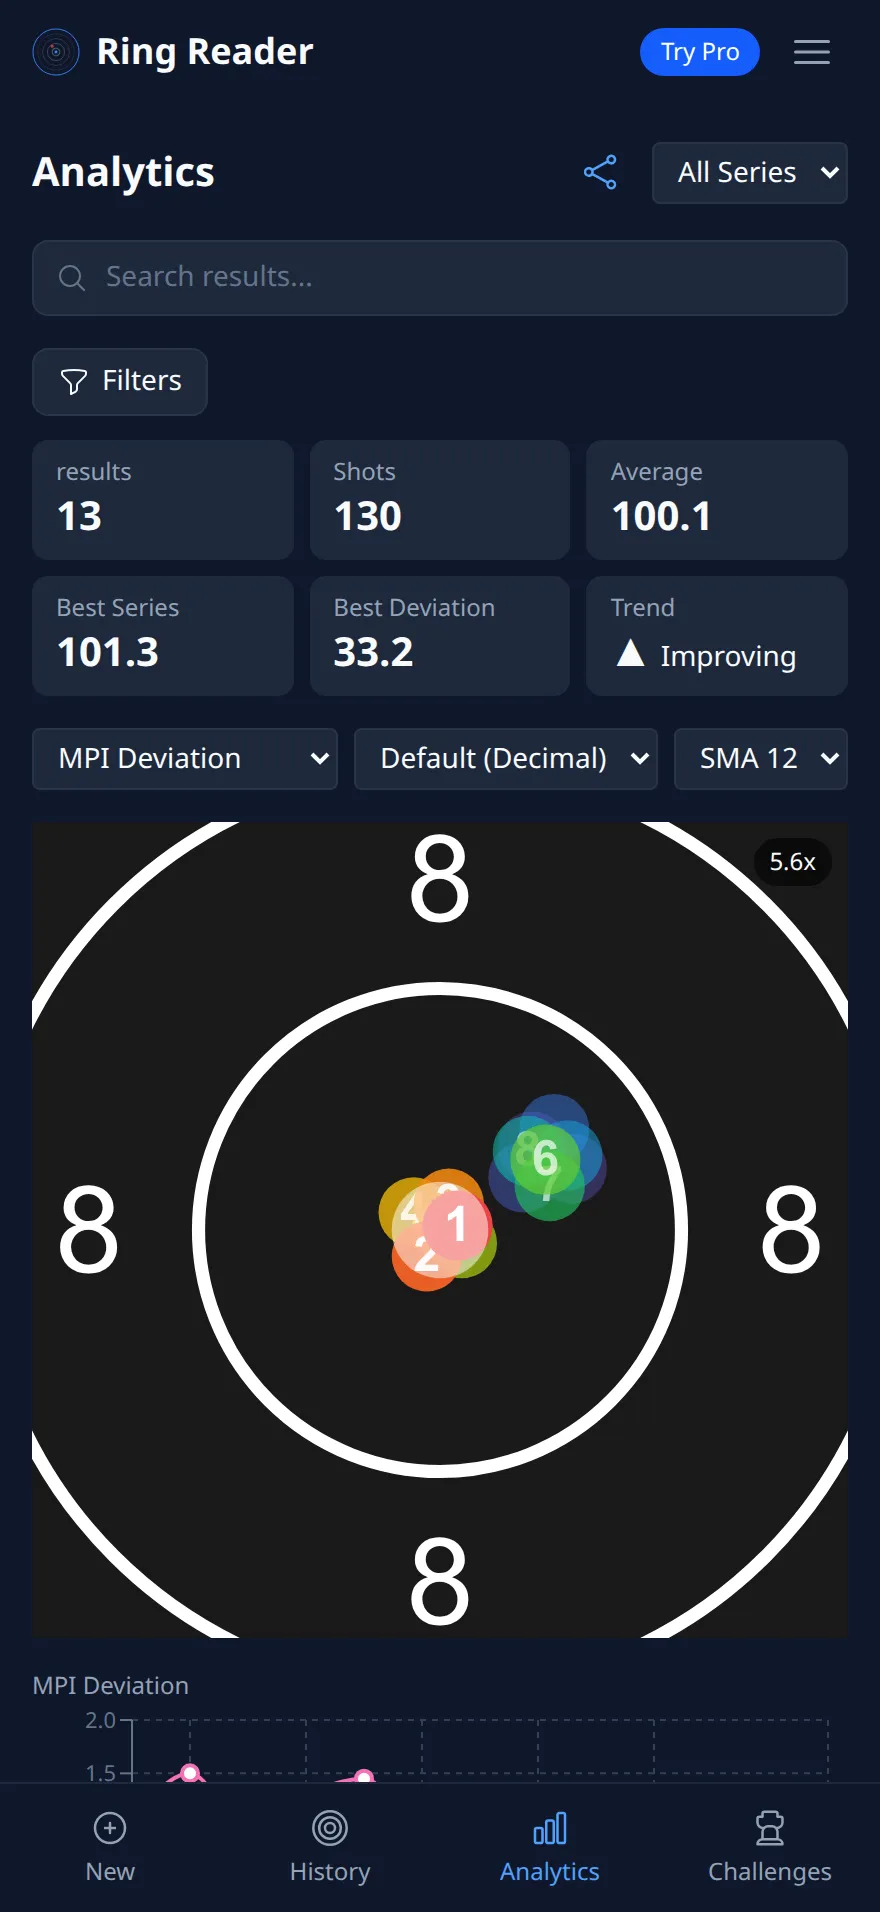
After a few series with the new setting you open the “MPI Deviation” view once more. The new dots, red and connected, should now lie around the center, and the older ones, violet to green, stay high and right. In the line charts the correction looks like a step, the line jumping from its old level to zero.
The second look goes to the profile. A tap on the profile card under Settings > Equipment shows the profile versions, and there every version shows the number of series and their average. If the average of the new version sits above the old one after ten series, the correction delivered the share the “Corrected” line promised. If it stays the same, the group sits in the center, and still something else changed along with it, and that is the next question.
Frequently asked questions
How many series before the correction?
Enough for the dots in the polar chart to form a cloud. A line across the target means the offset is still wandering. The “Rings left on the table” card in Insights computes from five series and says whether the offset holds up statistically.
Should I correct sideways and height separately?
Analytics shows both separately, X and Y, and both can be set in one step. Correcting separately only helps if you suspect one of the two axes of coming from technique.
What about the offset at an unfamiliar range?
Note the clicks in the training details of the series there, under “Clicks H” and “Clicks V”, and leave the profile unchanged. The Analytics filter by location shows you later whether the unfamiliar range has an offset of its own.
Look at the “MPI Deviation” view before you next turn the sight.
Take a look