 Blog
Blog
What the mean point of impact says about your technique
Summary: The mean point of impact (MPI) is the average of all shot positions in a series, shown as a single point on the target. If it sits off center, the whole series is not centered, however tight it is. Whether the sights or your technique are behind it, a single series cannot tell you. The course over weeks can. Ring Reader shows it to you in the “MPI Deviation” view.
One point, two numbers
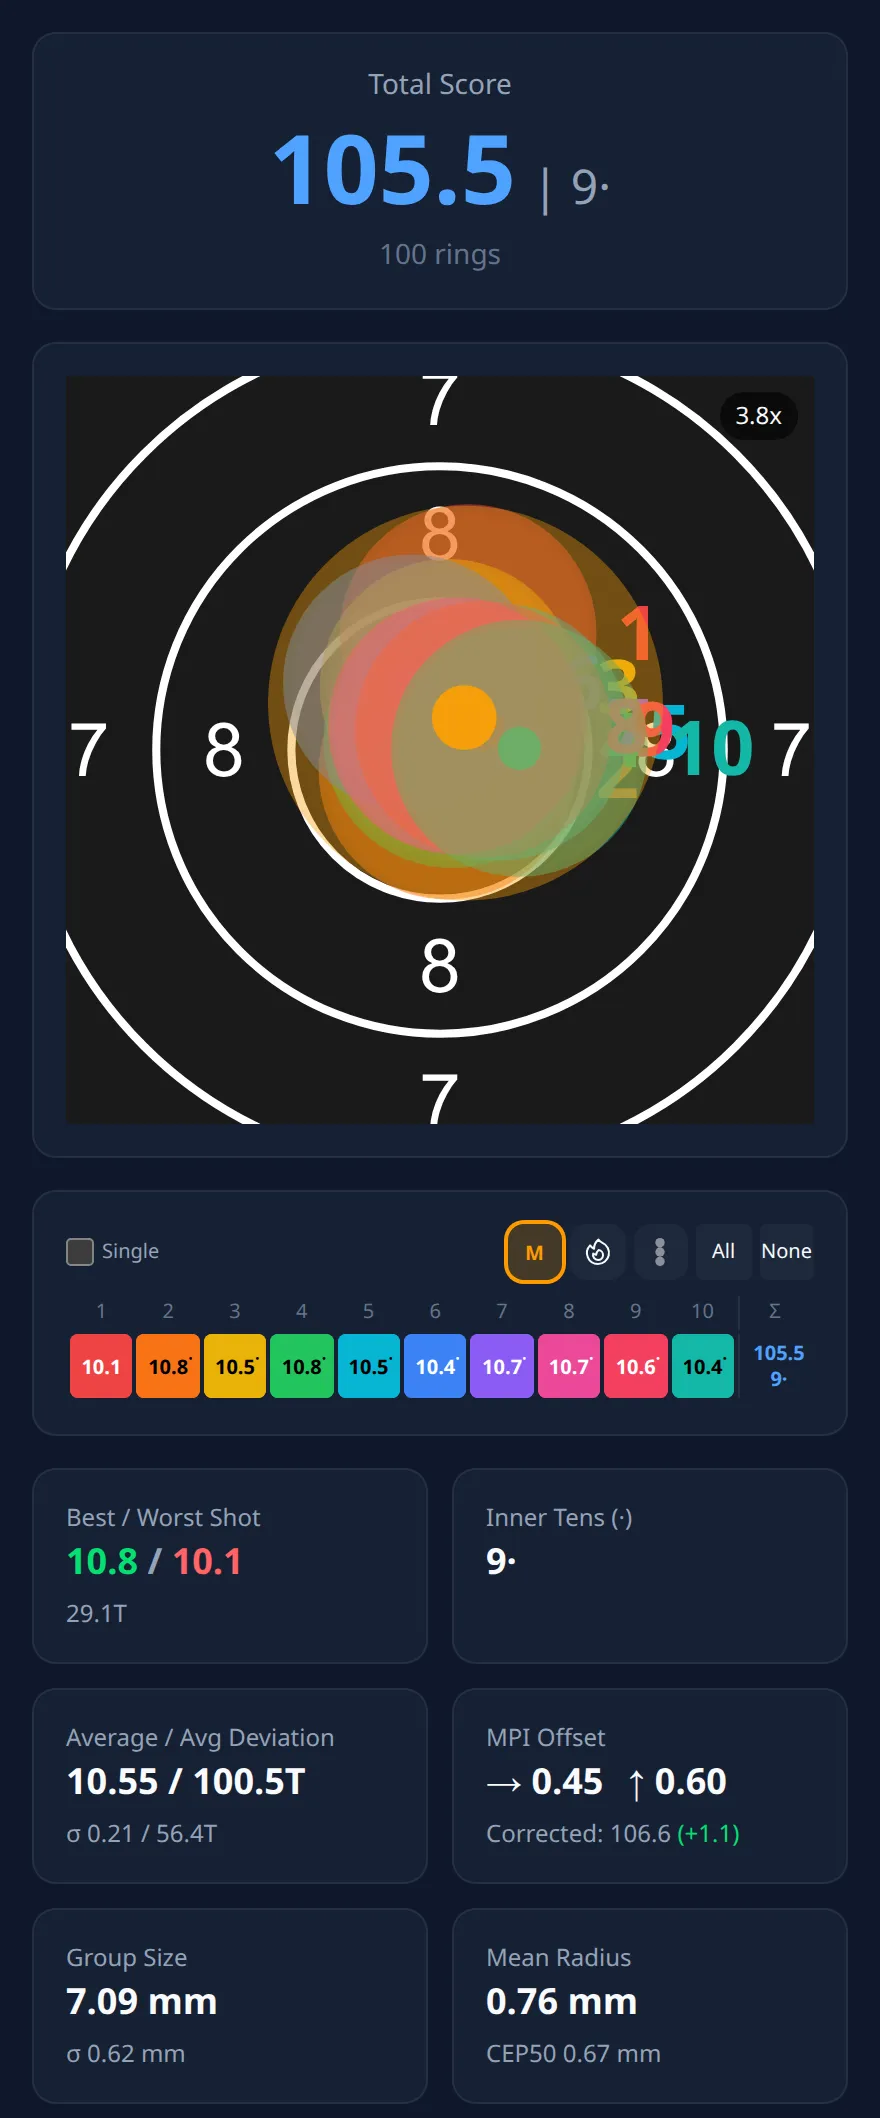
Ring Reader measures each shot’s position in millimeters as an x,y deviation from the target center (sideways and in height). The app averages both values over the series. The result is a point. The M button below the target, tooltip “Mean Point of Impact”, draws it in orange. The “MPI Offset” card further down shows its two distances from the target center with arrows for the direction, e.g. 0.45 mm to the right and 0.60 mm up.
That number answers the question of where the series sits. How tight it sits is a different question, and the “Group Size” and “Mean Radius” cards next to it cover that one. The app computes the horizontal and vertical spread around the mean point of impact; the target center plays no part in it. So a series can be extremely small and still sit half a ring off center. In a case like that, the sights deserve a look. If the point sits in the center and the group size is large, the sights are set correctly, and the spread comes from somewhere else.
For an import without a shot picture, say a Meyton printout that carries the group center as a number, Ring Reader takes the printed value. The M button then draws the center point onto the empty target, and the “MPI Offset” card shows it as well when only some of the shots have a precisely determined position.
Sights or technique
One click on the rear sight moves every shot by the same amount in the same direction. The telltale sign of a sight error in the shot picture is that the MPI offset is always about the same size and points the same way, whether the series is good or bad. On the result page, the “MPI Offset” card works out what that costs you in rings. The “Corrected” line shows the score the same shots would have reached with a centered group, in the example above “Corrected: 106.6 (+1.1)”. How that line comes about is in What would the series have scored without the sight error?.
How you stand and shoot moves the point too, by a different amount each time. A different position, a tired arm toward the end, a different range with different light or a new lot of ammunition: all of that changes from series to series, and the mean point of impact wanders with it. Which causes coaches check first for a group in a given spot is shown on the shot correction chart.
| What the course shows | Where it more likely comes from | What you can do |
|---|---|---|
| The point always sits in the same spot off center | Sights or position, something that stays constant | Set the clicks, then keep watching |
| The point jumps in different directions | Form on the day, hold, light, concentration | Leave the sights alone, look for the pattern in the shot picture |
| The point drifts slowly in one direction over weeks | Something has changed gradually, say the position or the ammunition | Check what changed in that time |
| The point sits in the center, the group size is large | Spread, so technique | Read the spread cards, leave the sights be |
The course: the “MPI Deviation” view
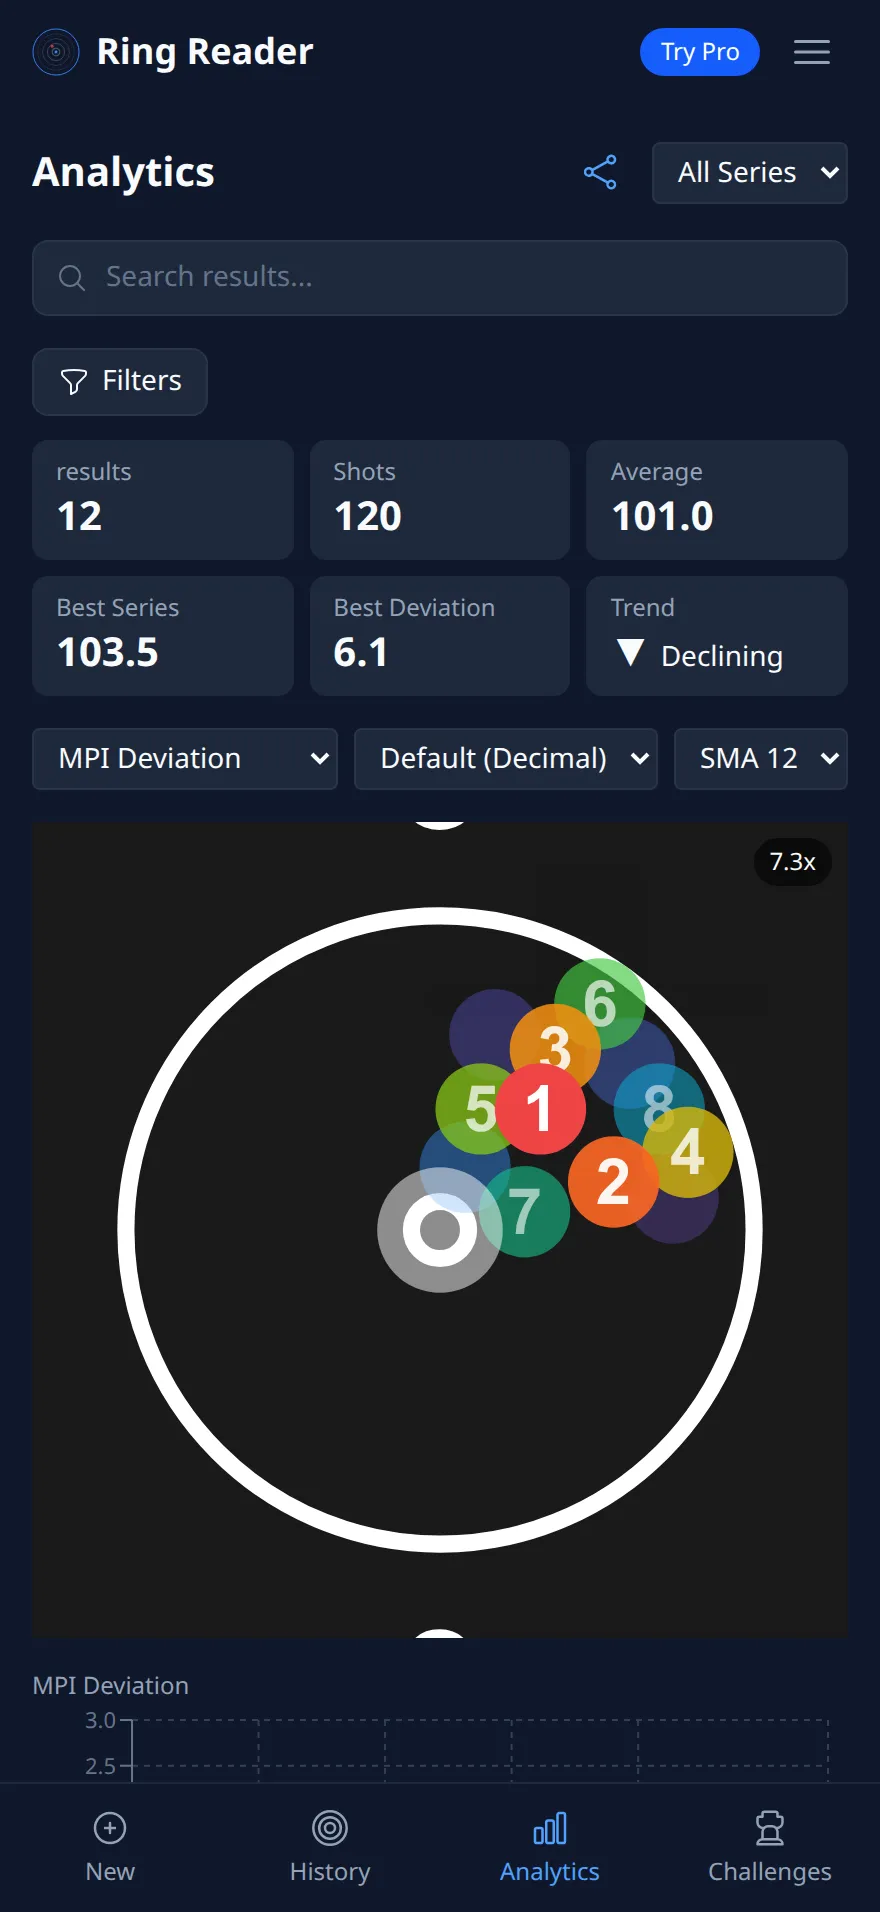
Open the “Analytics” tab and pick the “MPI Deviation” option. The first chart is a target on which every series sits as a dot at the spot of its mean point of impact. The colors run from violet for the oldest series to red for the newest; older dots fade. The last eight series carry numbers, 1 being the newest. They show at a glance whether your series circle around one spot off center or lie all over the place. The target zooms, because the dots of a good week often all sit within one millimeter.
Below it lies the “MPI Deviation” chart with two lines over time, X for the sideways deviation and Y for height, plus a zero line for the target center. If a line sits above zero for good, that is the constant offset from the first row of the table above. If it fluctuates around zero, the second row applies to you. The third chart, “|MPI|”, shows only the point’s distance from the center, without direction, and so answers the question whether the offset is getting smaller overall.
Both course charts have a moving average, and you pick its window under “Moving average window (results)”, between 12 and 60 series. It is only drawn once there are more series than the window covers. A tap on a legend entry hides the line, and when you run a finger over a dot, the same series is highlighted in the other two charts.
Where the positions come from
For the mean point of impact, every series needs shot positions. For photographed targets, Ring Reader measures them from the holes. From other results, e.g. from Meyton and DISAG systems, the app reconstructs them as well as it can. Only series with determined shot positions go into the course charts. Which format delivers which data is in the chapter Supported Formats.
The next step
With Ring Reader Pro, the “Insights” view answers the sight question across your whole archive. The “Rings left on the table” card shifts every series to the center on paper and gives the gain in rings per 10 shots, once five series with a shot picture are in and the gain holds steady across the series. How the six cards work is in Insights: six cards.
If you adjust the sights after that, keep track of the clicks. The weapon profile has the “Sight clicks” entry for it, and the training details of every series carry the “Clicks H” and “Clicks V” fields under “Gear & Setup”. If you change a profile that is already attached to earlier series, Ring Reader creates a new version. The old series keep their setup, of course.
In the polar chart you then see over the next weeks whether the mean point of impact has moved to the center. How to work out the exact number of clicks for your sight is in Adjusting sights with numbers. The sight click calculator turns the offset straight into clicks.
Frequently asked questions
How many series do I need before I trust the course?
For the polar chart, a few series are enough to see a pattern. The moving average only draws once there are more series than its window covers. At the smallest setting of 12, that means from 13 series. The “Rings left on the table” card computes from five series with a shot picture and only gives a result once the finding holds up statistically.
Does this apply to supported shooting too?
Yes. Supported, the groups are much tighter, so an offset of half a millimeter weighs more there than freehand. Ring Reader never pools supported and freehand; in Analytics you filter by discipline.
Why does my imported series show an MPI but no shot picture?
Some printouts carry the group center as a number without printing the individual shots. Ring Reader takes that number and draws the point onto the empty target via the M button. No shot picture comes from it, and the series is missing from the course charts, because only series with a shot picture are taken into account there.
Open Analytics and set the chart type to “MPI Deviation”.
Take a look