 Guide
Guide Statistics & Trends
Without Pro, Analytics runs over the up to 10 series on your device; with Pro, over your whole archive. The “Insights” view and the export need Pro.
In the Analytics tab you analyze your progress over any time period. Here you see statistics, charts and trends at a glance.
Opening Analytics
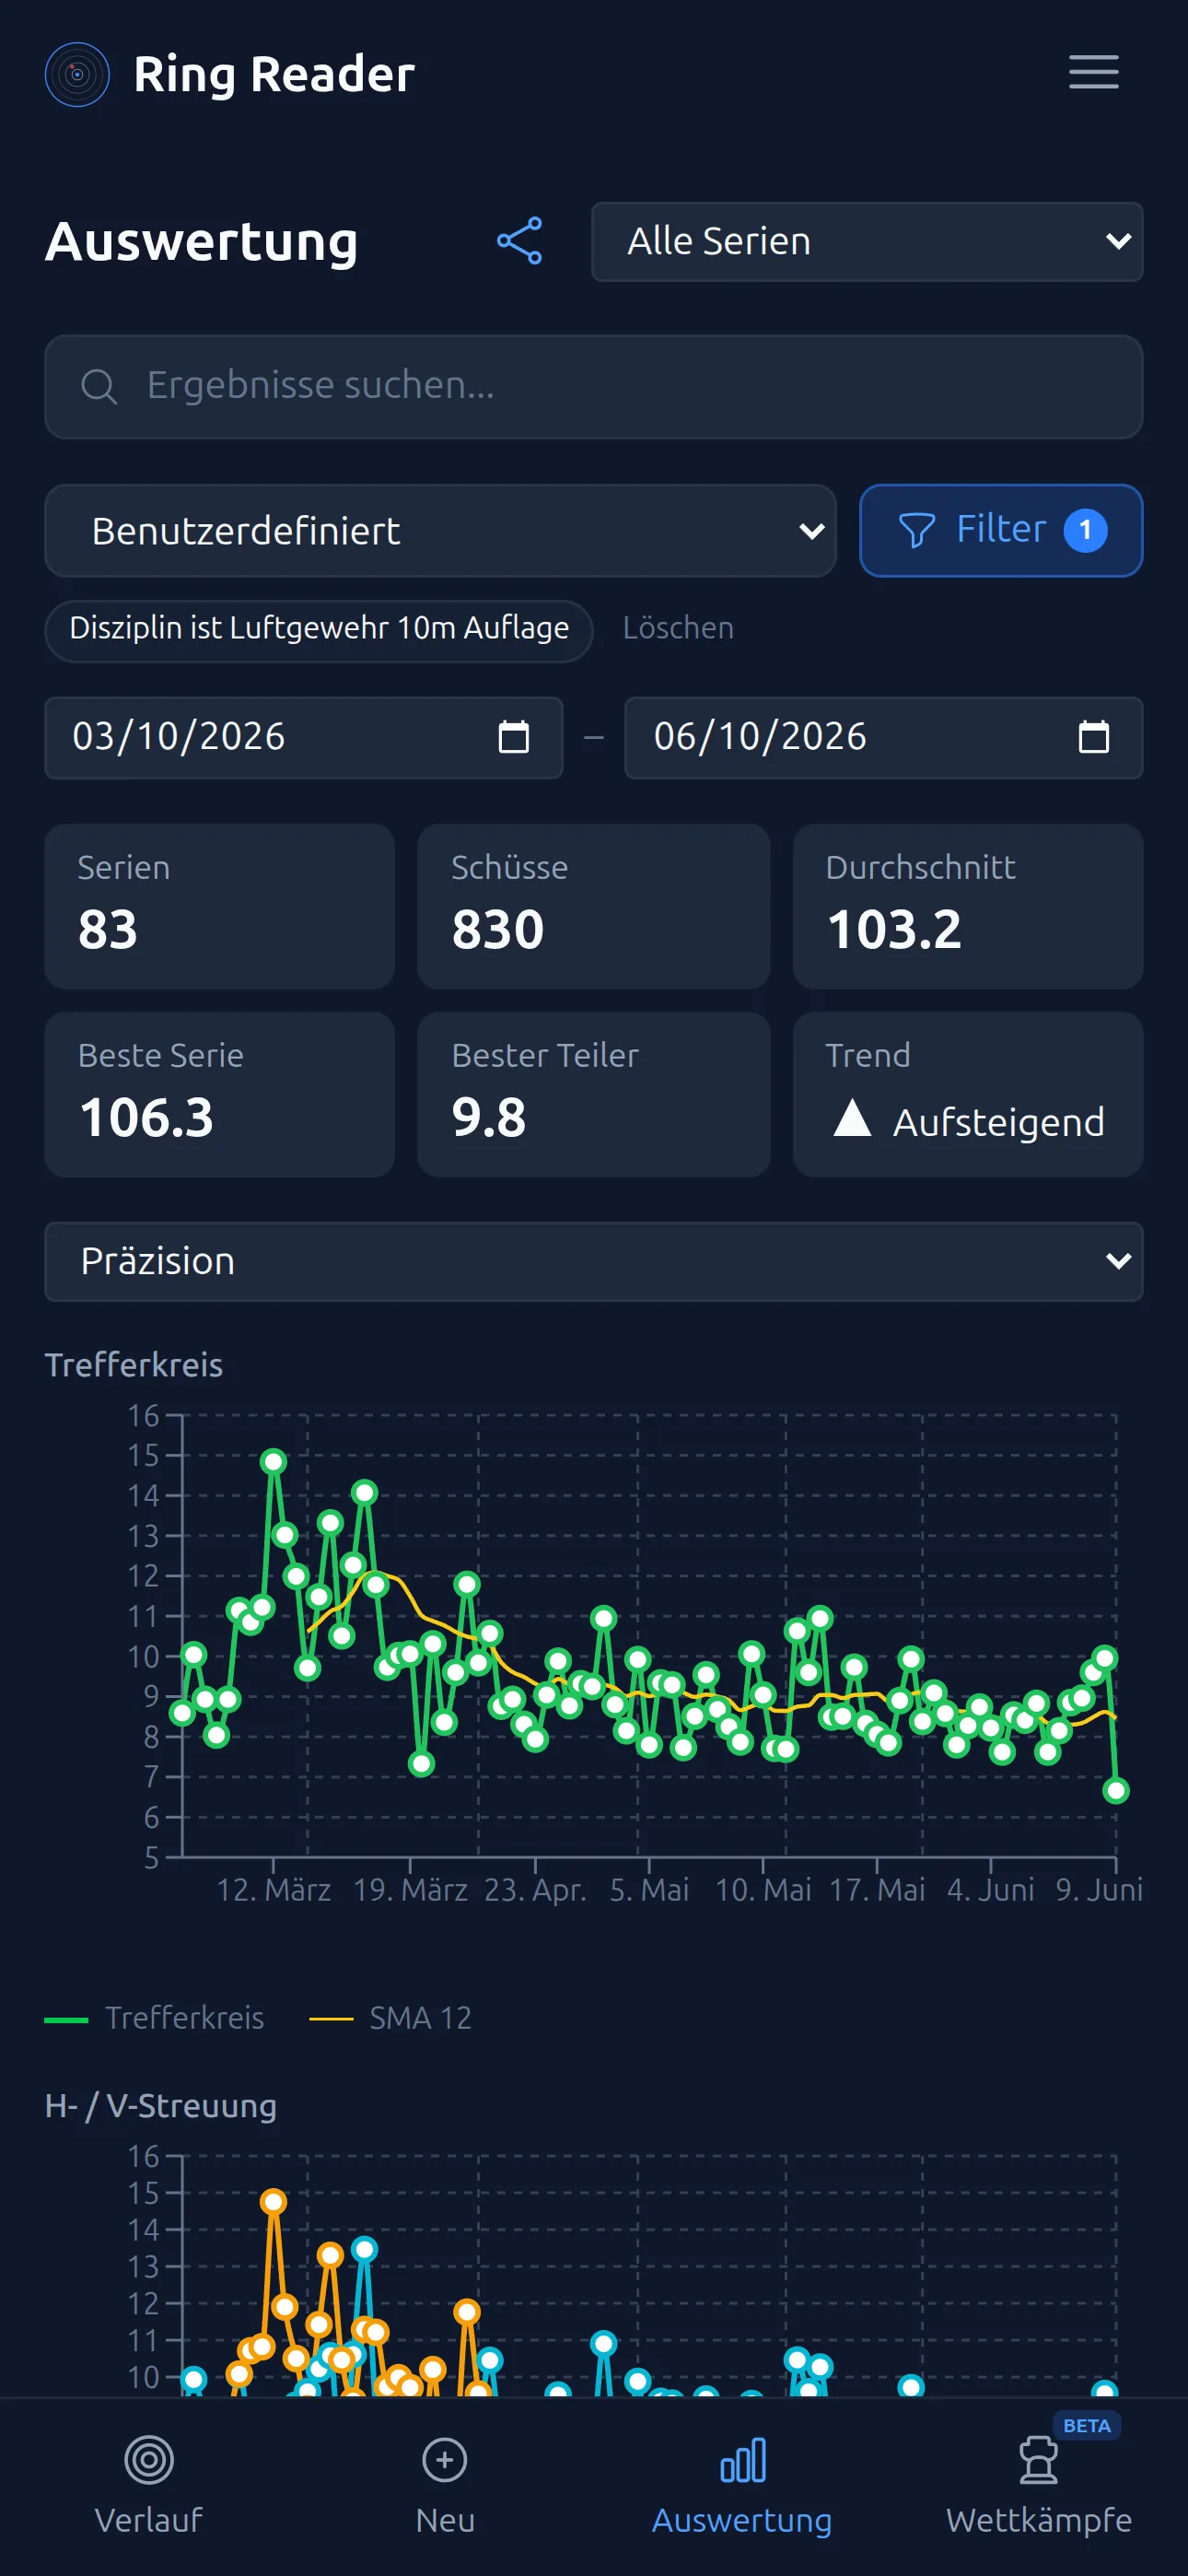
Tap “Analytics” in the bottom navigation. At the top is the “Analytics” heading with an “All Series” dropdown. Use this dropdown to filter by a particular group, or pick “All Groups” to analyze your groups side by side. In this mode, “Convert to virtual … shots” converts all groups to a common shot count so that 30-shot and 60-shot groups can sit in one chart (Pro); records are not affected.
Filtering
Below the heading you’ll find two controls:
- Saved filters — a dropdown with your filter presets. This lets you quickly recall frequently used filters.
- Filter button — opens the detailed filter options for custom settings.
Choosing a time period
In the filter you pick the “Date range” from presets such as “This month”, “Last 3 months”, “This year” or “All time”, or set “From” and “To” yourself. Without a choice of your own, Analytics shows the last three months with Pro and all time without Pro. If there’s no data, the message “No results found for this period.” appears.
Choosing a chart type
Use the “Chart type” dropdown to switch between the views:
- “Score” — your ring-score trend over time, with average, best and trend.
- “Distribution” — how your shots are distributed across the ring values.
- “Deviation” — your Teiler trend over time.
- “Range” — the range of your results.
- “Precision” — group size and spread (see below).
- “MPI Deviation” — where your mean point of impact sits (see below).
- “Records” — personal records, goals and streaks.
- “Insights” — six cards with patterns from your archive (Pro, see below).
- “Heat map” — all measured shots of a discipline on one target (see below).
Next to the chart type you set the scoring mode (Default, Decimal or Whole Rings); it applies to all charts and figures. For the score, Teiler and precision charts, “Moving average window (results)” sets how many series (12 to 60) the trend line smooths over.
Precision analysis
These charts belong to the “Precision” chart-type view. It shows two charts:
- Group size — the diameter of the smallest enclosing circle (green) with a rolling average.
- H / V Spread — horizontal (cyan) and vertical (orange) spread over time.
MPI analysis
These charts belong to the “MPI Deviation” chart-type view. It has three charts of its own, all about the mean point of impact:
- Polar chart — an interactive target with the MPI positions of each series as colored dots. The last 8 series are connected as a numbered path (purple → red = old → new).
- MPI Deviation — X offset (pink) and Y offset (violet) over time, with a zero reference line and rolling average.
- MPI distance — the distance from your mean point of impact to the target center across series, also with a rolling average.
How to read the three charts and tell sights from technique is in the blog post What the mean point of impact says about your technique, and how to derive the sight clicks from them in Adjusting sights with numbers.
The charts within a view are synchronized — hovering over or tapping a data point highlights the corresponding point in the other charts.
Interactive legends
Below the trend charts (group size, spread, MPI deviation, MPI distance) sits a tappable legend: tap a series to hide it — to highlight just the vertical spread, for example. Hidden series are shown struck through; a second tap brings them back.
Insights (Pro)
The “Insights” view analyzes one discipline family, which you pick in the dropdown above it, and shows six cards:
- Shot position in the series — which shot of a series drops off or stands out on average, say the first or the last.
- After a bad shot — how the next shot turns out.
- Rings left on the table — how many rings per 10 shots a centered mean point of impact would bring.
- Training vs. competition — the difference per 10 shots between the two series types.
- Where do the bad shots go? — the direction rose of your worst shots.
- Conditions — a comparison by ammunition, location, weekday, time of day or training gap.
Every card says so when the data isn’t enough yet, and only reports differences that hold up statistically. The “Based on” line above tells you how many series and shots went in. How the six cards compute and when the data is enough is in the blog post Insights: six cards.
Heat map
The “Heat map” view lays all measured shots of a discipline family from the chosen time period on one target and colors the density. You can zoom in; below it you see how many series the shots come from and how many of them have no position.
Personal records
In the “Records” view you see your best performances at a glance — including:
- Best Shot — your highest single shot (decimal scoring).
- Best Series — your highest total ring score for a series.
- “Best Deviation” — your lowest Teiler (your shot closest to the center).
- Best Groups — your best 10-shot to 60-shot groups, including virtual groups spanning multiple series.
When you set a new record, it’s updated automatically and, with Pro, highlighted on the result page as “New PB!”.
Goals
In the “Records” view, under “Goals”, you can set your own training goals — for example a particular series ring score or a target Teiler. This keeps your progress in view. How a goal turns into a training plan is covered in Training Planning.
- Tap “New goal” to create a goal.
- Choose the goal type: “Score target” — picking a metric: group total, series total, single shot or deviation —, “Consistency” or “Training frequency” (per week, month or year).
- Set the target value and, optionally, a deadline — Ring Reader shows you whether you’re “On track” or “Behind pace”.
Training & performance streaks
Also in the “Records” view, Ring Reader counts two kinds of streaks:
- “Training streak” — consecutive weeks in which you trained at least once.
- “Performance streak” — consecutive series whose ring score matches or beats your average.
For both, the current and the longest streak are shown. This lets you see whether you train regularly and whether your performance stays consistently above average. What records, goals and streaks bring over months is in the blog post Track your shooting progress.
Exporting statistics
At the bottom of the page you’ll find two export buttons (Pro). Exported are all series matching the active filters, configuration and time period:
- “Export CSV” — one row per shot with date, score and position; ideal for your own analysis in Excel and the like.
- “Export PDF” — a summary table plus shot details as a document.
The share button additionally creates a score card of your analysis as an image. In the “MPI Deviation” view you can choose between the Square, Portrait and Story formats; all other views are shared as a Portrait card. More on this in Share a Result.
Use the group filters together with the time period to analyze specific training blocks or competitions in a targeted way.