 Guide
Guide View the Result
Overall result
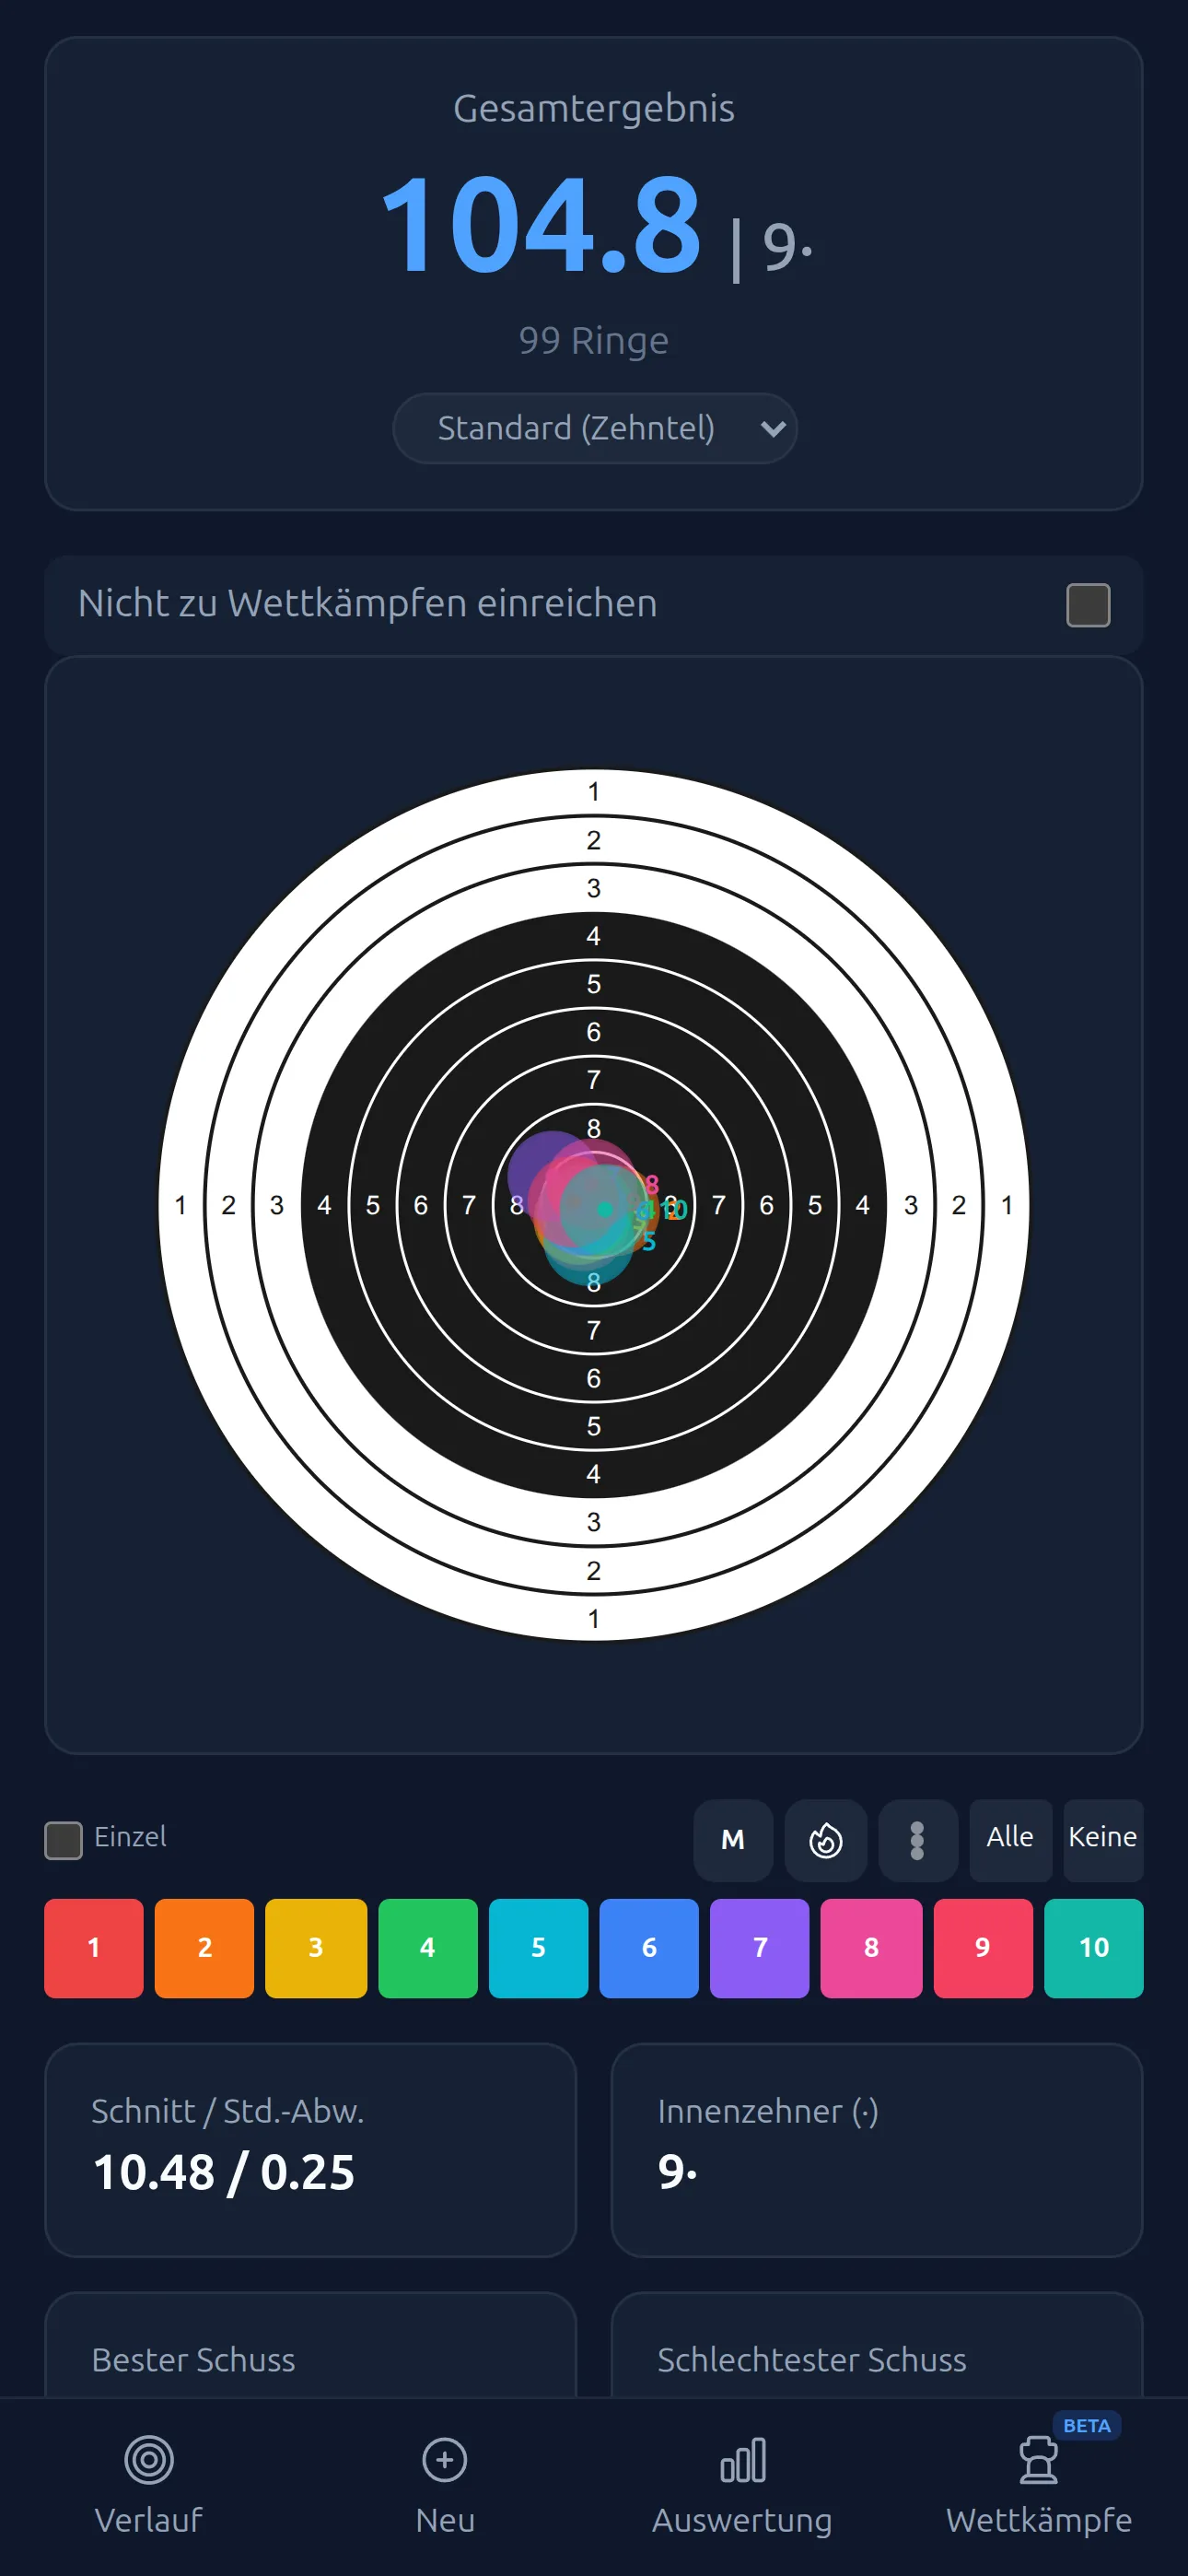
On the result page you’ll see the total score of your series (e.g. “104.8”). That’s the sum of all detected shots — so for a full strip, the sum of 10 shots.
If you shot inner tens, their count appears right next to the total (e.g. “104.8 | 3·”). For rifle, a shot of 10.2 or better counts as an inner ten; for pistol, 10.4 or better.
Below the score you can switch the scoring mode: “Decimal” (decimal scoring, e.g. 10.3) or “Whole Rings” (e.g. 10). The choice applies to this series only — with “Default” the scoring mode from Settings applies again.
What does the ring score mean?
Ring Reader uses ISSF decimal scoring, the same as in competition:
- The target has 10 rings — ring 10 is the center, ring 1 the outermost.
- In decimal scoring, the exact position of the shot is measured, not just the ring.
- Example: 10.3 means the shot lands just inside the 10 ring.
- The maximum score per shot is 10.9 (a perfect center).
What is the Teiler?
The Teiler is a finer unit of measurement than the ring score, and measures the distance of your shot from the exact center of the target:
- 1 Teiler = 0.01 mm of deviation from the center.
- The smaller the Teiler, the better — 0 would be a perfect shot dead center.
- The Teiler lets you compare shots even within the same ring. Two shots scoring 10.3 can have different Teiler values — the one with the smaller Teiler sits closer to the center.
How a Teiler turns into a tenth is covered in the blog post Teiler and ring score. The Teiler calculator converts single values.
Shot pattern
All shots are overlaid on a single combined target card. This lets you see your grouping at a glance. The target view zooms up to 100× — perfect for inspecting individual shots closely.
- You can show or hide individual shots by tapping the number buttons.
- Use “All” and “None” to switch quickly between all shots and an empty view.
- The “Single” toggle in the button row below the target switches to single-shot mode: only one shot is visible at a time.
- MPI (Mean Point of Impact): The MPI shows the average of all shot positions. Tap the MPI button to see where you tend to hit. This helps you spot systematic deviations (e.g. always slightly to the left). How to read its position is covered in the blog post What the mean point of impact says about your technique.
- Corrected score: The “MPI Offset” card holds a line like “Corrected: 106.6 (+1.1)”. It shows what the same shots would have scored with a centered mean point of impact; the green value in brackets is the difference to the score you shot. More in the blog post What would the series have scored without the sight error?.
Heatmap
A flame icon in the button row below the target turns the heatmap on and off. The heatmap shows shot density as a color gradient (thermal image) on the target. While the heatmap is active, other shot displays (single shot, color mode) are disabled. It requires coordinate data — for imports without shot positions it’s not available.
Color mode
The color icon in the same row cycles through coloring by score: off (each shot in its own color), 10 = red, 10 = green, and a gray, orange and blue variant for red-green color blindness. The tooltip names the active mode, and your choice is remembered. The colors also apply to the shot buttons under the target — so you can spot all the 8s at a glance, for example.
Place shots
The pencil in the toolbar opens “Place shots”: tap or drag a shot to where it actually was. It stays on its ring, so ring score and Teiler don’t change. Shots with a Teiler but no direction, say from a Disag printout, sit on the target as a dashed ring at the Teiler distance and can be slid to their position the same way. “Undo” takes it back one step at a time.
Playback
In single-shot mode, a play button appears next to the “Single” toggle. It plays all shots in sequence as an animation (1 second per shot). Each shot sits alone on the target, with its ring and Teiler shown in the middle of the button row. You can stop playback at any time.
Statistics
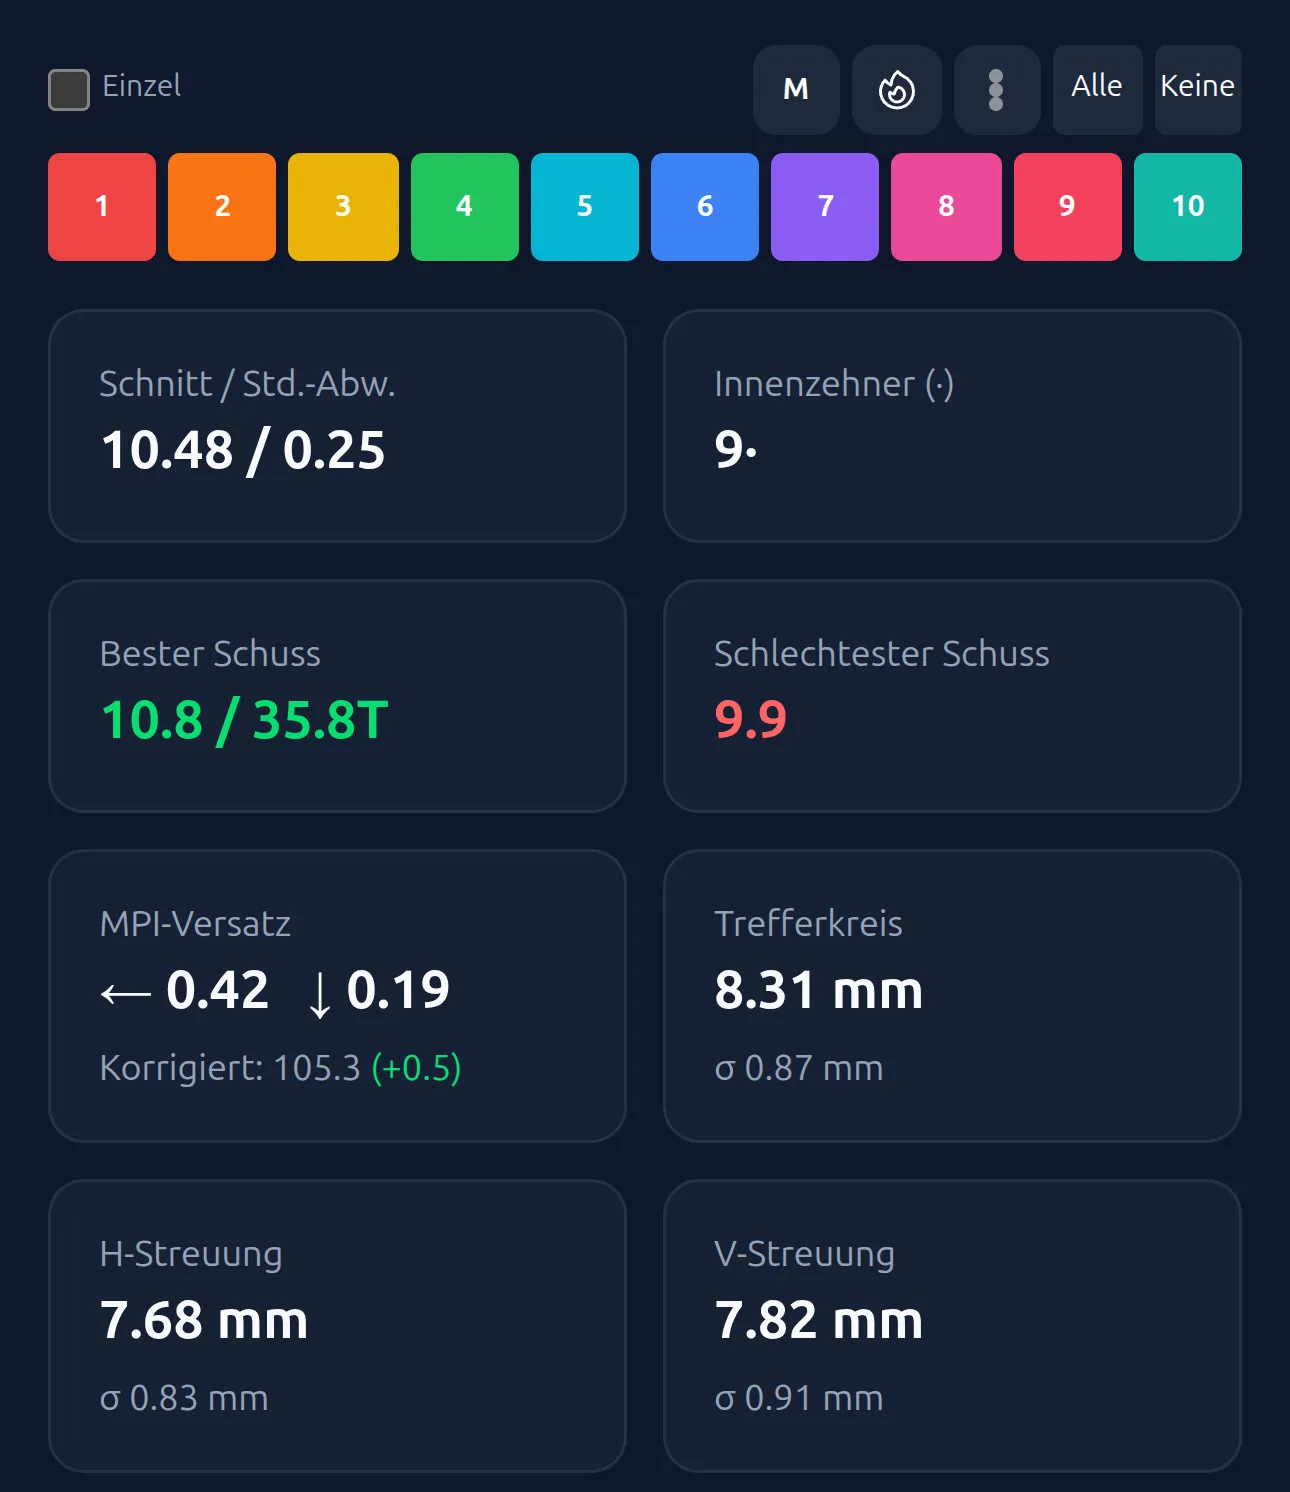
Below the shot pattern you’ll find the stat cards summarizing your result (how to read them is covered in What Do Your Numbers Say?):
- Best Shot and Worst Shot: Highest and lowest ring score, the best shot with its Teiler.
- Inner Tens (·): How many shots count as inner tens.
- Average / Avg Deviation: The mean ring score and the mean Teiler of all shots; below them the standard deviation as a measure of how consistently you shoot.
- MPI Offset: The distance of the mean point of impact from the target center in millimeters, with direction; below it “Corrected”, the result with a centered point of impact. The sight click calculator turns the offset into clicks on your sight.
- Group Size (Trefferkreis): The diameter of the smallest circle that encloses all the shot holes, from outer edge to outer edge. A small group size indicates tight grouping.
- Mean Radius: The mean distance of the shots from the mean point of impact, plus CEP50, the circle around the point of impact that contains half the shots. Neither value depends on the caliber.
- H-Spread and V-Spread: How much your shots deviate sideways and in height.
Charts
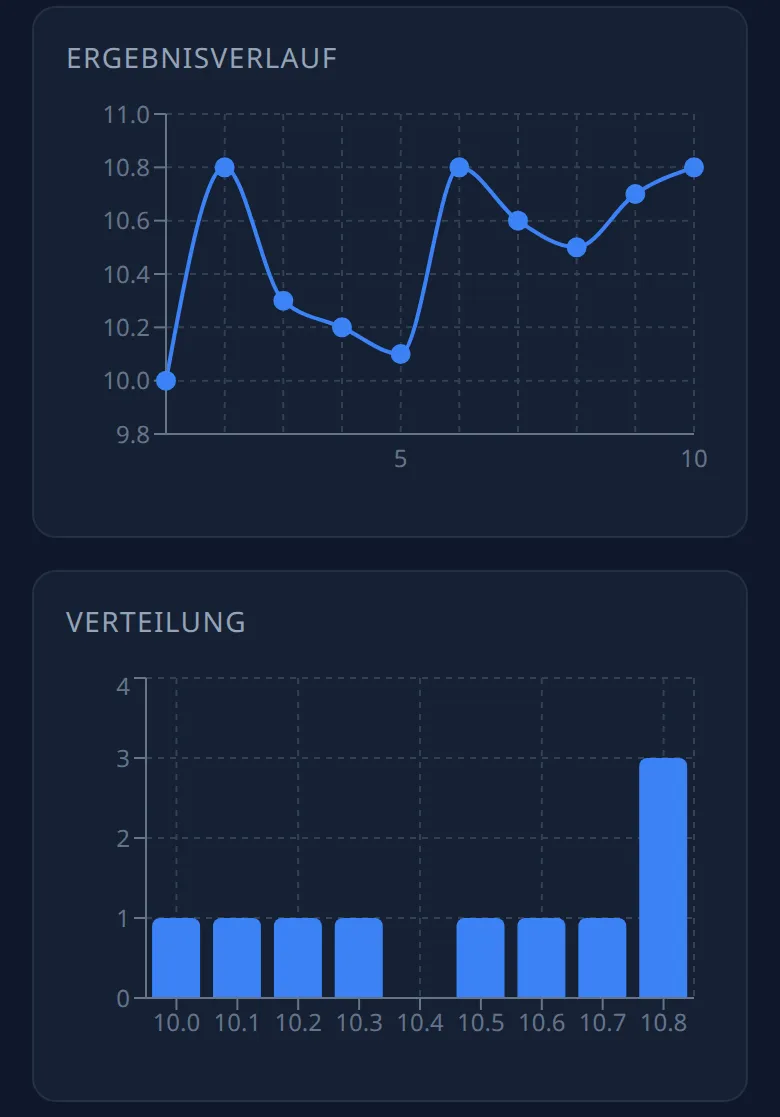
Two charts help you understand your result better:
- “Score Trend”: Shows how your ring scores progress from shot 1 to shot 10. This reveals whether you get better or worse over the course of the series. For imports with timing data (Intarso, SETA, SKAS, LogMan, SIUS shot list, Meyton 25 m pistol), the chart additionally shows the “Shot time” next to the scores — so you can see how long you took for each shot.
- “Distribution”: A bar chart showing how often you hit each ring value.
Shot breakdown
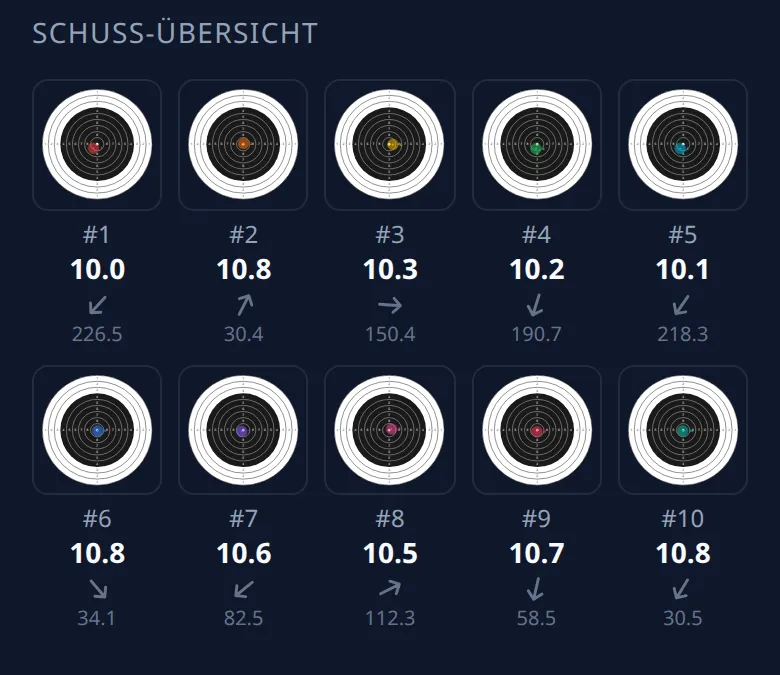
In the “Shot Breakdown” section you see each shot on its own: a mini target card shows the position, along with the ring score and the Teiler. This lets you review every shot in detail.
Correcting order and rotation
Three buttons in the header help when detection has mixed up the numbers or the orientation:
- “Reverse order” flips the numbering of all shots, say when the strip was photographed upside down.
- “Rotate 90°” turns all positions by a quarter turn (paper targets).
- “Set order” shows the shots as a list; a tap highlights the shot on the target, and the arrows move it forward or back (paper targets and WM-Shot series).
Previous/next navigation
The up and down arrows next to the heading open the entry above or below, in the order of your history or of the group you came from. While you scroll, they also appear at the bottom right. This lets you move between series without going back to the History page.
Editing the title, date and details
Date, discipline, weapon and location sit in the “Details” bar below the result. A tap expands the editing controls, and the state is remembered.
- Tap the title to give the series a name (e.g. “Tuesday club training”).
- Tap the date to adjust it — handy when you score a photo later on.
- If you change the discipline, Ring Reader rescores the shots on the new target.
All the other fields are explained in Training & Notes.