 Blog
Blog
Your first ten series: what to read and what to ignore for now
The initial setup of your training diary in Ring Reader was covered in Season start: set up your training diary in 15 minutes. This post is about the first 10 series after that.
| After series | What you learn | What is still unclear |
|---|---|---|
| 1 | Score, inner tens, “Best Shot” with its Teiler, every shot in the “Shot Breakdown” | Whether the series was good for you, whether the “MPI Offset” is a pattern |
| 3 | Whether the mean point of impact lay in the same direction three times | The trend in your score curve |
| 5 | ”Best Series” and “Best Deviation” under “Records”, a first goal | The “Performance streak”, a goal’s forecast |
| 10 | ”Average” and the Teiler average across all series | The trend line in the “Score” chart, which needs thirteen series |
Series 1: the result page
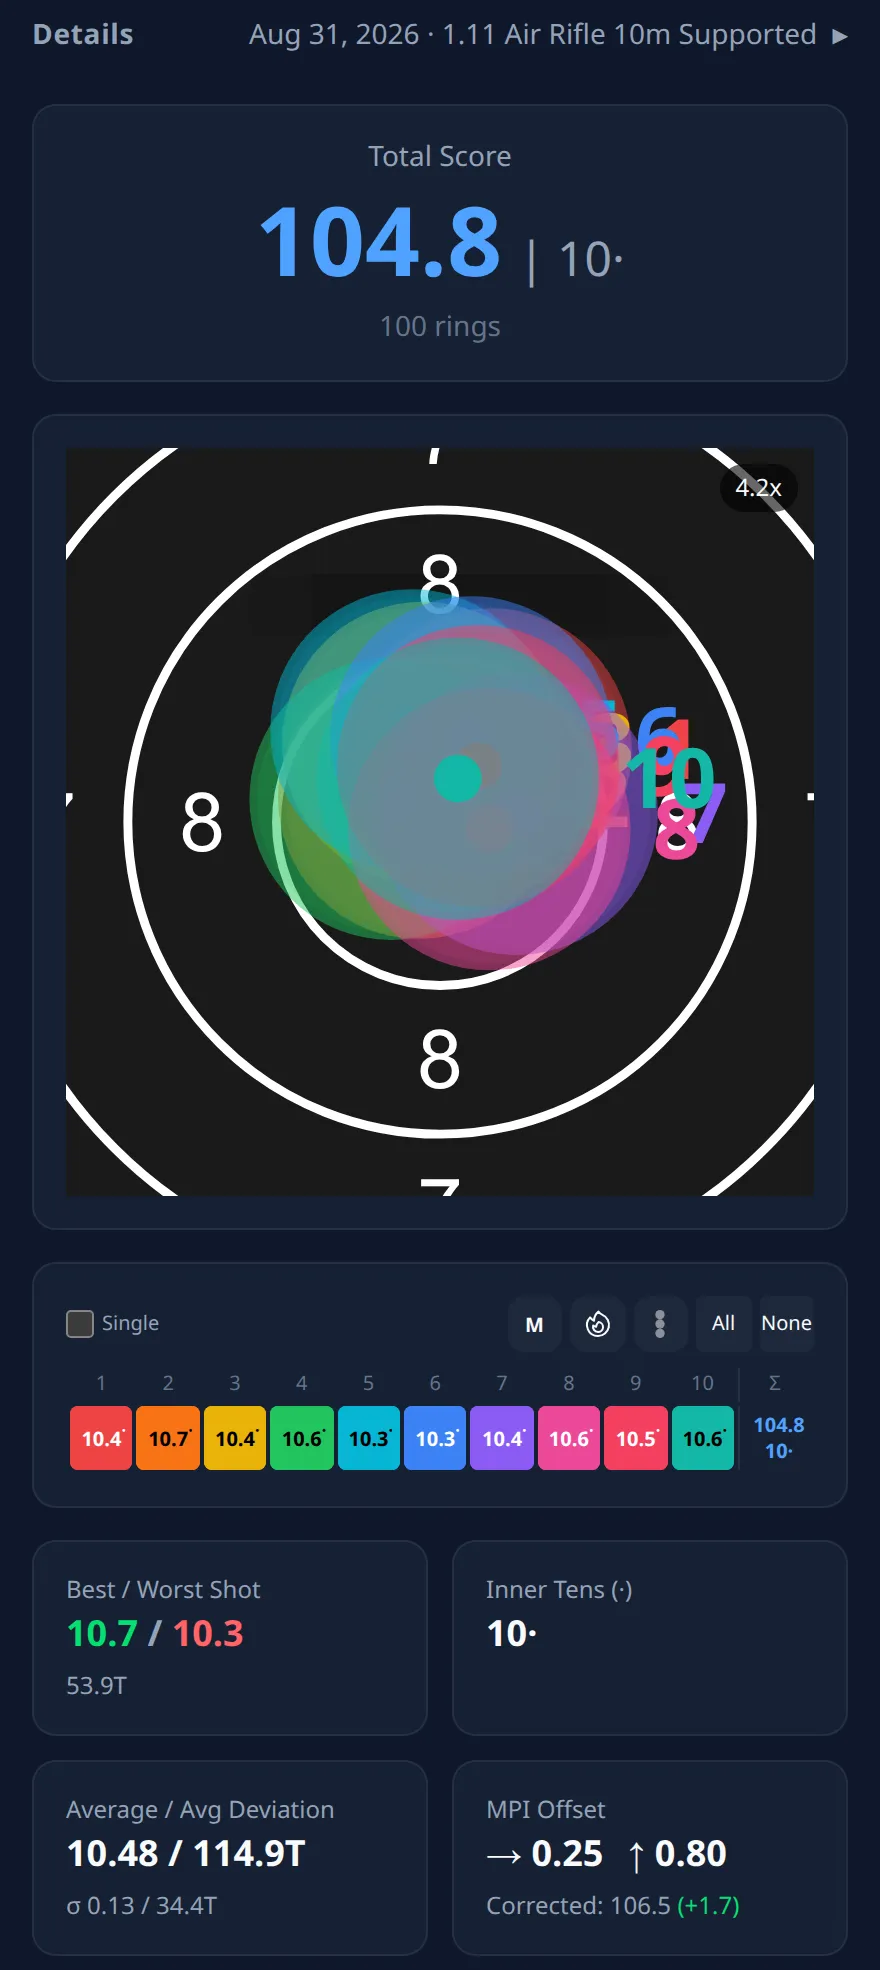
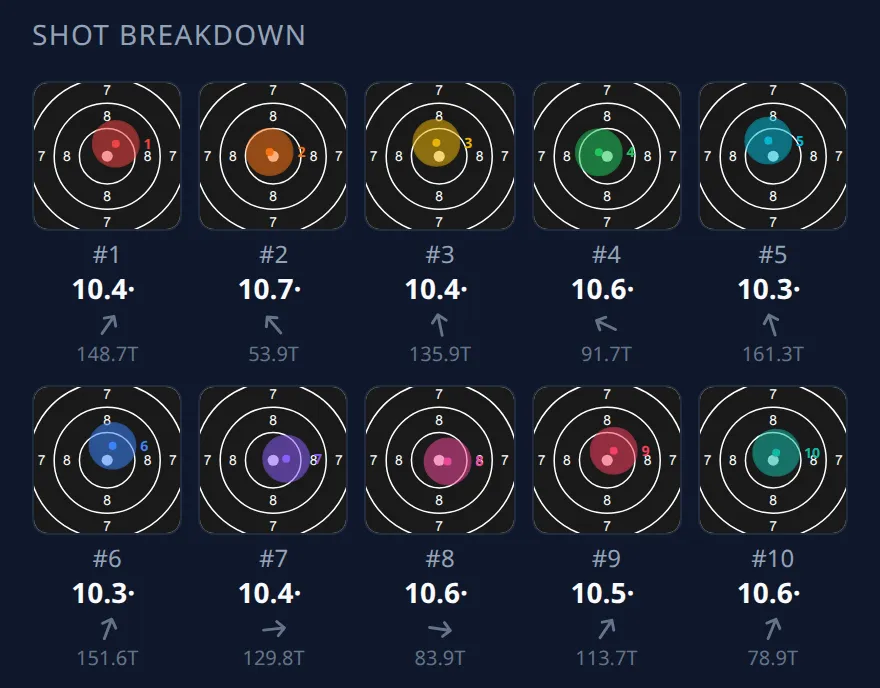
At the top sits the total, say “104.8”, and next to it the number of your inner tens, from 10.2 for rifle and from 10.4 for pistol. The “Best Shot” card names the shot with the highest ring value and the smallest Teiler. The Teiler is the distance from the target center in hundredths of a millimeter, so 25 T is a quarter of a millimeter. In the “Shot Breakdown” every shot has its own small target card with ring score and Teiler.
The “MPI Offset” card says how far your mean point of impact sits from the center and in which direction. Below it stands “Corrected”, the result of the same series, only with a centered point of impact. Whether the offset is a pattern you only know once it repeats.
Series 3: the direction of the point of impact
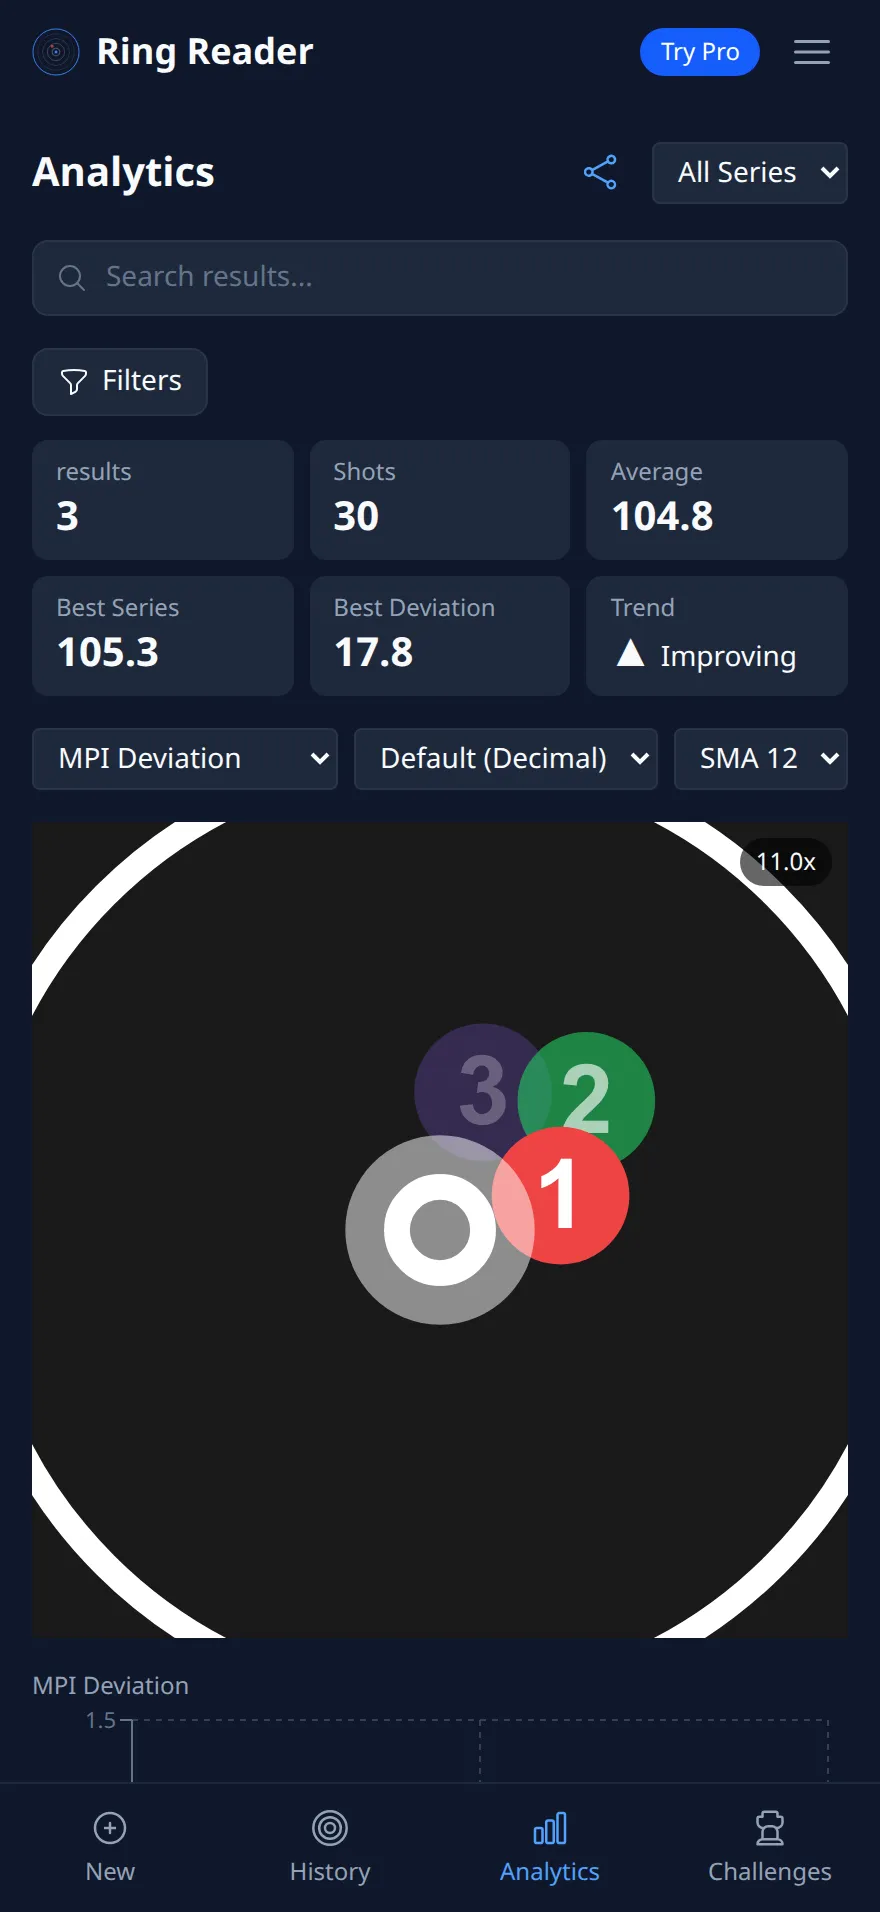
From the third series on it is worth checking whether the “MPI Offset” points the same way every time. In Analytics, the chart type “MPI Deviation” places each series’ point of impact as a dot on a target and connects the last eight as a numbered path. If the three dots all sit high and right, you have an offset, and the value under “Corrected” tells you what it costs you per series. Spread around the center, it was scatter.
The rest is still noise. History shows the “Score Trend” curve from the second result on, and with three points it has no direction yet. With three series, “Improving” on the “Trend” tile in Analytics only means the last two averaged above the first, because the tile compares the later half of your series with the earlier half. And the trend line in the “Score” chart is still missing altogether. It smooths over at least twelve series, so until the thirteenth the chart reads “SMA 12 from 13 results” (SMA: simple moving average, at each point the average of the last 12 series).
Series 5: records and a first goal
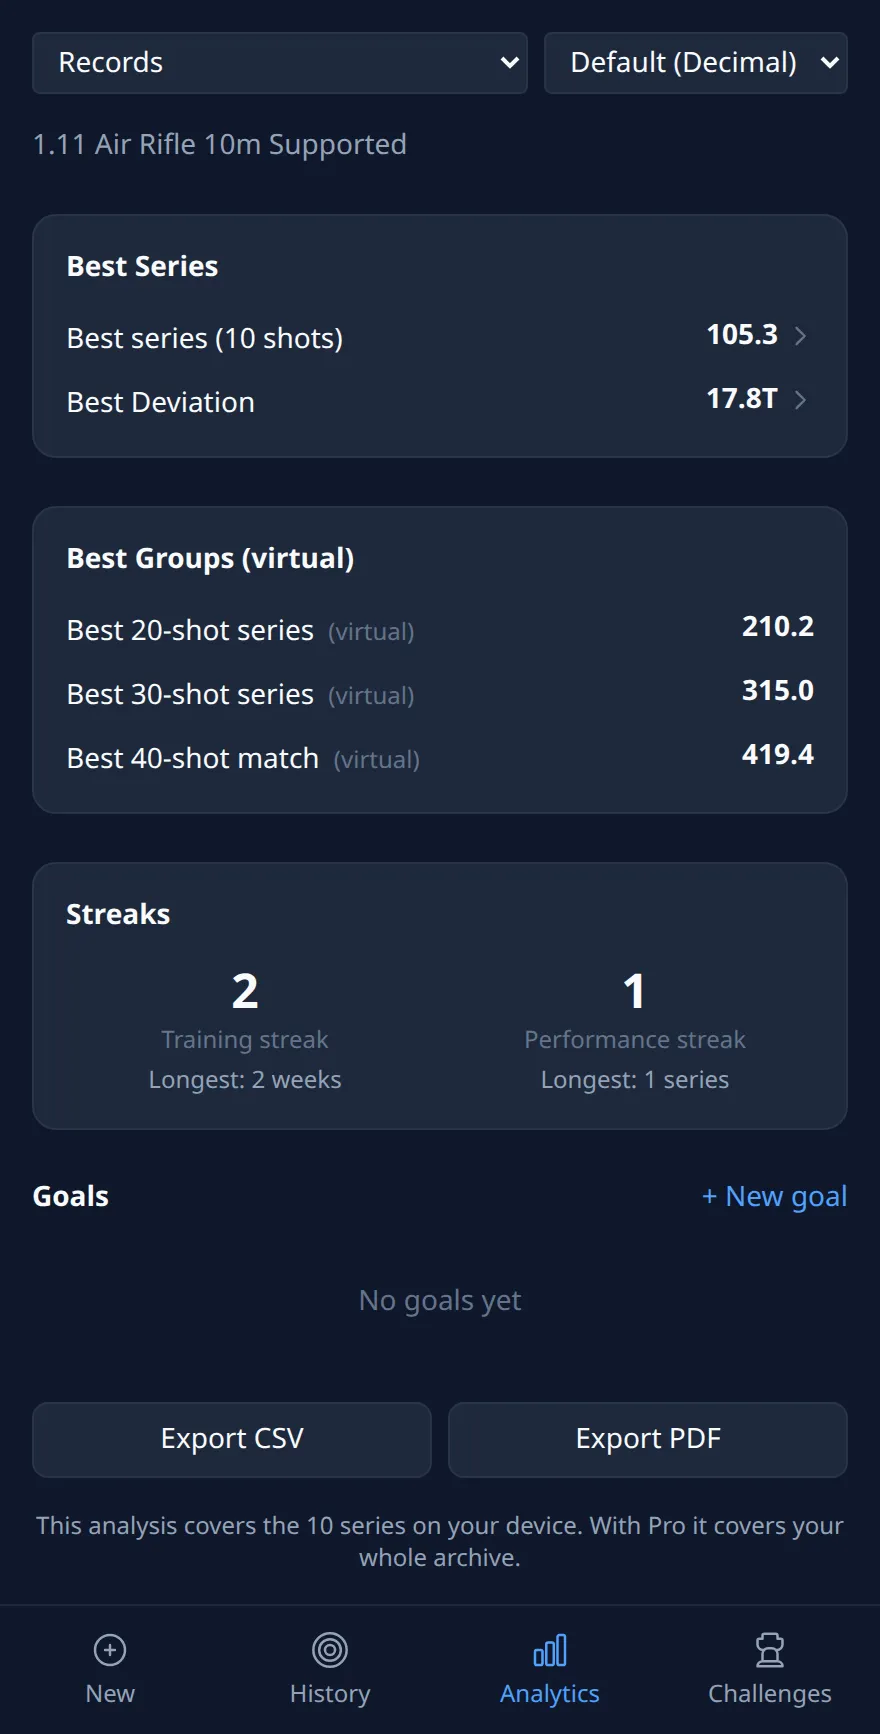
Under “Records” in Analytics, “Best Series” and “Best Deviation” are filled from the first series on, because the first series holds both automatically. A record gets interesting once it has something to beat, after five series four other series. From the second series on, the result page shows “New record!” with Pro, and below it which one it is, something like “Best series · Best Deviation” with the new Teiler in parentheses.
Now it pays to set yourself a goal, because the forecast has something to work with. Under “Goals” you create a “Score target” with ”+ New goal”, a target value and a deadline, and Ring Reader works out from the series you have whether you are “On track” or “Behind pace”, along with a forecast date. With five series the forecast is still rough.
The “Performance streak” next to it counts consecutive series that reach your own average. With five series that average still moves with every new one. What records and streaks bring over months is in Tracking your shooting progress.
Series 10: the average and the free version’s limit
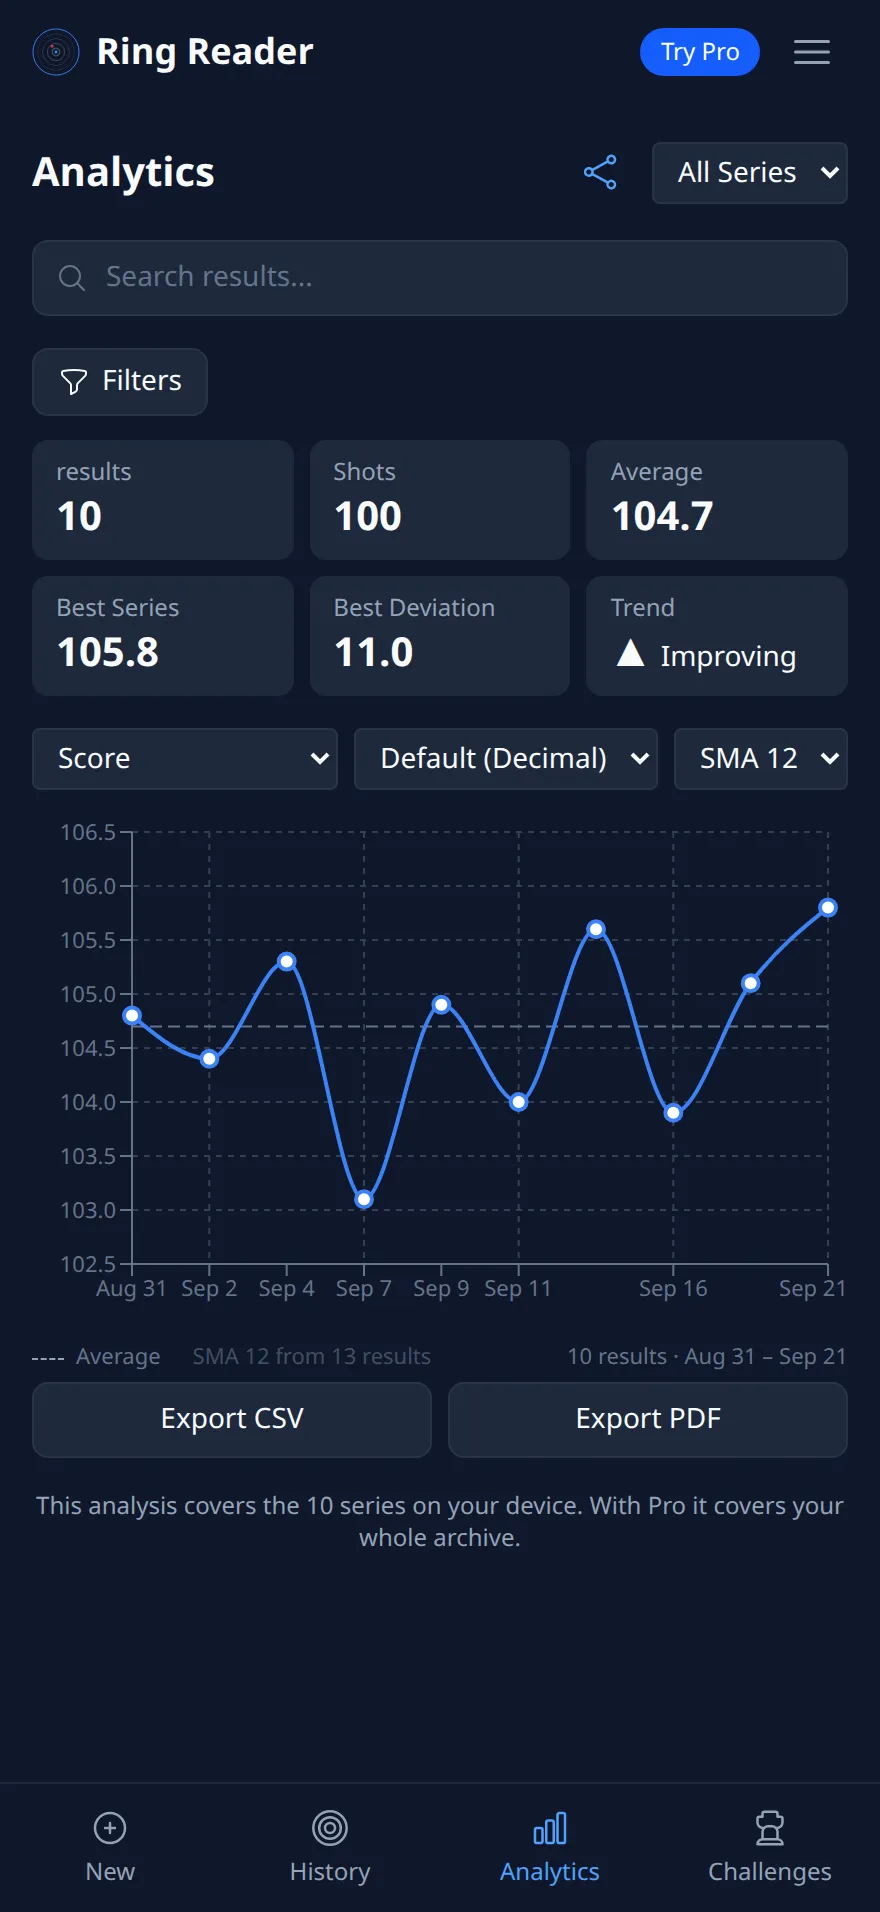
On every result page, “Average / Avg Deviation” shows the mean of that series’ shots, with the standard deviation below as a measure of how evenly you hit. The standard deviation stays almost untouched by a single flyer, unlike the “Group Size”. Across all series, Analytics does the math, as the “Average” tile and as the dashed line in the “Score” chart. From ten series on, that average is the number you measure a new series against. The Teiler average often moves earlier than the ring score, because two shots with the same ring value can sit at different distances from the center. Which question each figure answers is in the chapter Interpreting your numbers. The charts are explained in Statistics & Trends.
At the tenth series the counter also speaks up. Without Pro, Ring Reader keeps ten results on the device, and History then reads “10 / 10 results”. If you are close to the limit, delete old sighting series or the demo data first. Ring Reader keeps more series with Pro, and for that you need an account.
An account and the first challenge
Up to here everything worked with “Continue without an account”. You need an account once your results should reach a second device or you want to use Pro. Through the menu, “Sign in” and “Register” you reach “Create your account”. With “Continue with Google”, the scans on the device move into the new account. With Pro, Ring Reader then syncs the series between your devices. What else is in Free and Pro is listed in the chapter Getting started.
Where your best result stands in comparison is on the “Challenges” tab. You can look at the “Monthly Challenges” and their leaderboards without Pro. If a new result fits a running challenge, the result page shows the card “You’d be rank #… of … in …” with “Join challenge” once you have an account. Joining itself needs Pro and a public username. Set tags and notes from the first series on, as described in the season-start post, so you can filter by them in History.
Frequently asked questions
When does my average become meaningful?
A single series is the form of the day plus chance. The average holds up from about ten series, and the trend line in the “Score” chart appears from thirteen. Compare like with like, the same discipline and the same position. The Analytics filters help with that.
Do I need an account for the first ten series?
No. “Continue without an account” takes you straight into the app. You scan and keep ten series with shot pattern and statistics on the device. You need an account for Pro, for a second device, for challenges and for training rosters.
What if the ten slots are full?
History then reads “10 / 10 results”. The counter runs from the first series on. Delete old sighting series or the demo data first, that makes room. With Pro there is no limit, and for that you need an account.
Scan the first series and look at the point of impact after the third.
Open Ring Reader